YFTI training and coaching models are supported by an innovative data collection and visualization system that utilizes standardized documentation for HFW charts and a data dashboard system for viewing data in real time. Since implementing the data collection process in 2013, we have collected data on over 1800 youth and families.
We can provide information about how the model is implemented with fidelity, satisfaction of youth and family members, how wraparound teams are moving through the process compared to key benchmarks in the model, and outcomes related to families and youth feeling better supported, achieving their vision, and needing less mental health services and out of home placement.
Youth and Family Have Complex Needs
System Involvement
76% of the youth enrolled in HFW are involved in two or more of the child-serving systems (mental health, child welfare, juvenile justice, alternative education, special education, drug and alcohol, physical health).
Trauma
70% of the youth enrolled in HFW experienced trauma in their lifetime. Almost 35% of youth experienced trauma in five or more categories.
Presenting Problems
The most common concerns facing youth and families at the start of HFW are depression, anxiety, hyperactivity, attention, behavior, school performance, caregiver mental health concerns, and suicide related problems.
Mental Health Diagnoses
The most common mental health diagnoses given to youth in HFW are attention-deficit / hyperactivity disorder, depression, oppositional-defiant disorder, anxiety, posttraumatic stress, autism, and bipolar disorders.
Mental Health Services
Almost 60% of youth have participated in high-level services like inpatient hospitalization, residential treatment, partial hospitalization, and crisis / emergency services in the year before starting HFW.
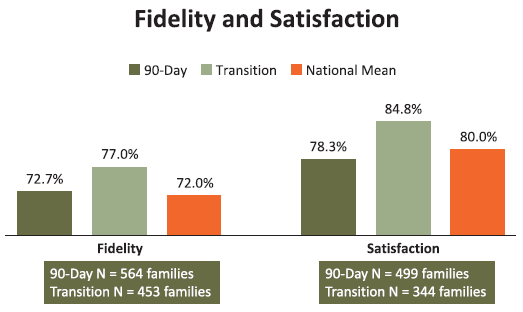
Fidelity and Satisfaction
YFTI began implementing the National Wraparound Fidelity Index – Short Form (WFI-EZ) in 2013 and has validated data from over 1,000 family teams. The overall mean fidelity scores for PA counties at both 90-days into the HFW process and at transition have been consistently higher than the national mean. In addition, satisfaction ratings taken from youth and caregivers are consistently high, and above the national mean at the transition assessments.
Process Benchmarks
The high fidelity wraparound process lasts an average of 277 days (around 9 months) based on data from 1343 youth already transitioned (discharged). We have analyzed process data to implement scorecard dashboards for viewing wraparound process benchmarks at both the aggregate level and family level. Coaches can access three scorecards structured around eighteen benchmarks for key events in the HFW process, targets for frequency of contacts with team members, and comparison points for fidelity and satisfaction data. This continuous quality improvement process identifies the strengths and challenges of each team and allows coaches to view their team summary and also drill down to check the status of each family enrolled to provide more support when coaching staff around specific family needs. Th is also provides opportunities for coaches with strengths in different areas to support each other with peer coaching.
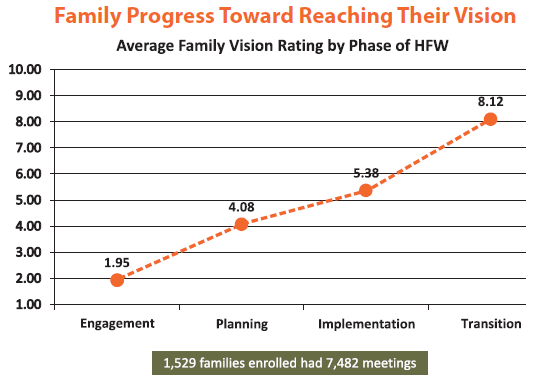
Youth and families set their own goals, develop a family vision, and then rate how close they feel they are to accomplishing it on a scale of 1-10 at each team meeting.
Data from over 1,500 family teams and almost 7,500 meetings show the average vision rating at the end of the engagement phase is 1.95 and the average vision rating grows to 8.12 by the transition phase. Setting realistic visions and helping coaches to monitor the vision progress is a key part of being able to transition families at the right time.
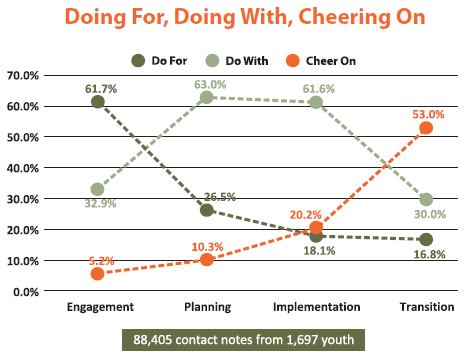
Another way of tracking when the HFW process has achieved a successful result is to track when the teams have moved from “doing-for” families or modeling key skills, to “doing-with” families or supporting them in learning the skills themselves, to “cheering-on” families or celebrating their successes and self-efficacy. The engagement phase begins with 34.4% of contacts “doing for” and only 2.9% of contacts cheering on”, but shifts to only 10.7% of contacts “doing for” and 32.2% of contacts “cheering on” by the end of the process. The shift demonstrates an increase in self-efficacy and confidence for youth and families to plan for their own needs.
Outcomes
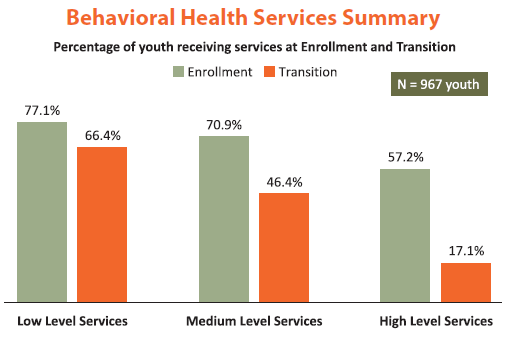
Youth and families are assessed during the engagement phase of HFW to determine what their utilization of services has been during the year before starting HFW and then assessed again when they transition out of the process. We have been monitoring a 40% reduction in HFW youth and families using high-level behavioral health services as well as a 25% reduction in medium level services and an 11% reduction in low level services.
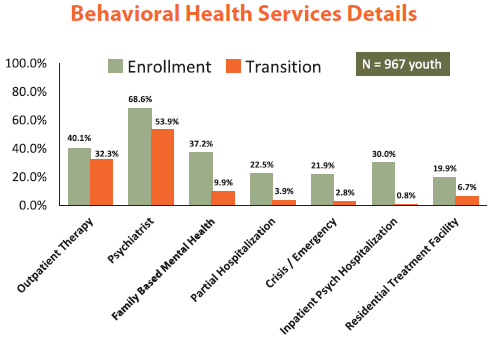
Here you can see a further breakdown of specific low, medium, and high level services where we are seeing decreases in utilization. Outpatient therapy (8%), psychiatrist (15%), family based mental health services (27%), school-based mental health services (9%), partial hospitalization (19%), crisis and emergency services (19%), inpatient psychiatric hospitalization (29%), and residential treatment facilities (13%).
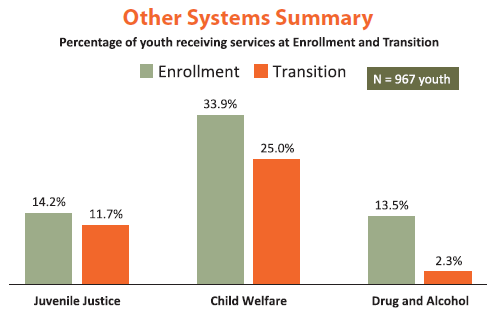
Some additional key outcomes are reductions in the other child-serving systems of juvenile justice (3%), child welfare (9%), and drug and alcohol (11%). These data indicate the importance of utilizing the HFW process for youth and families who are the hardest to reach and who result in the highest cost to the child-serving systems.
Data displayed on this page was collected in summer 2019.